Hi, I’m Laura, a third year History and Archaeology student and this will be my second year at the Digital Humanities Lab as an intern. My interests span 2D digitisation to 3D digitisation techniques such as RTI (Reflectance Transformation Imaging) and photogrammetry. I love how these techniques are applied to cultural heritage and wider research questions within the subjects I study. For this blog post, I am going to combine my love for 3D techniques and GIS (Geographic Information Systems). In my first year at Exeter, I attended an archaeology lecture given by Prof. Leif Isaksen (Director of the DH Lab) about the dig he directed at Cluny Hill, Scotland. He passed around a printed 3D model that showcased the topography of the land. It was the first time I had seen anything like it- the fact that you could almost picture the landscape and see the contours of it despite not being physically on location excited me. In fact, it started an obsession with landscape data and my love for its link to material culture within archaeology! And another with Digital Humanities!
After my first internship year with the lab, I began working with GIS data- first data cleaning, then (after exporting the data into QGIS) playing around with how to visualise the data. Within this second year at the lab and especially due to the pandemic, it has been helpful to continue this work from home and learning more about the skills needed in working with GIS software and also in using OpenRefine to data clean rather than doing this manually in Microsoft Excel. 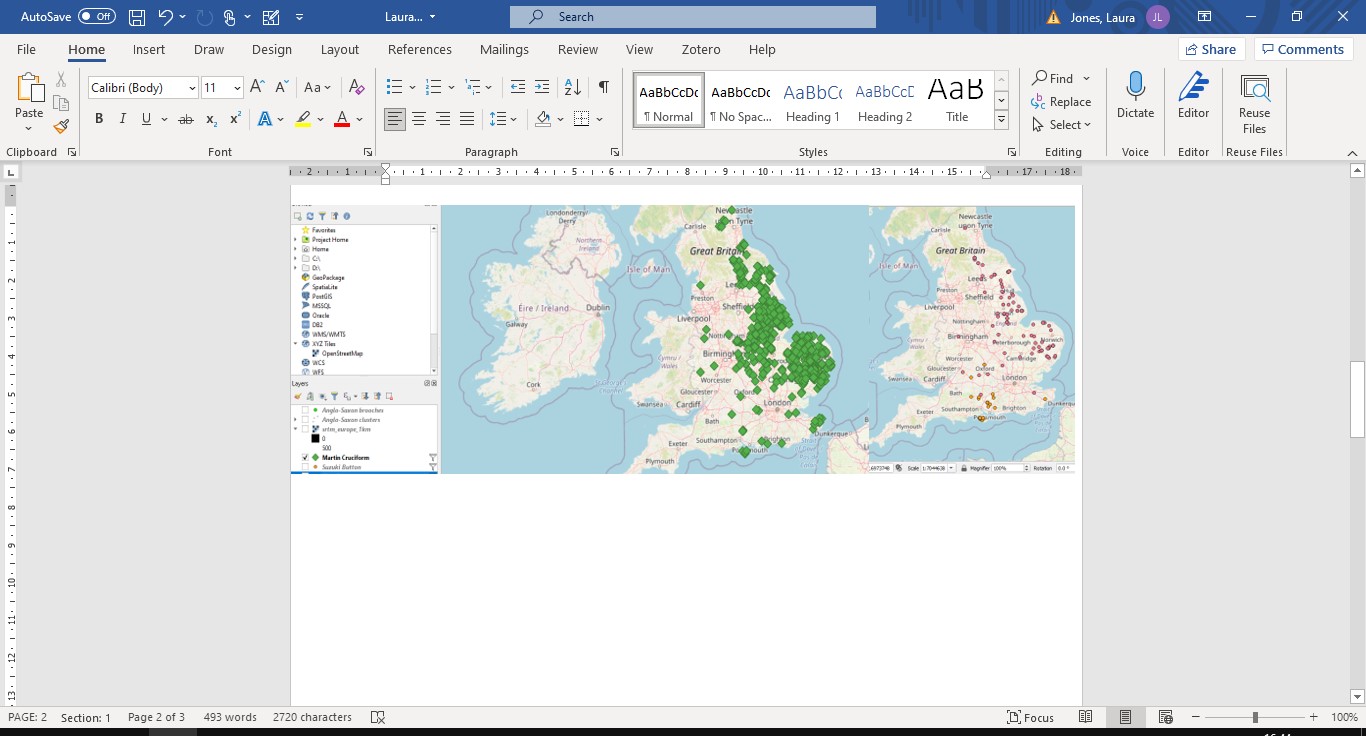 As you can see from the first image, I have been exploring filtering data so it shows specific categories (as shown by the colourful circles) and in the second map of the first image, clustering data points where there is data overlapping (shown by the triangles on the map). The triangles represent one cluster and underneath these clusters more than one data point exists within a similar radius. When handling huge datasets, it is good to explore patterns and distribution of data within GIS, which is what I have been doing with Professor Isaksen’s data for research- data that has been taken from the Portable Antiquities Scheme (PAS) on Anglo-Saxon brooches. Coming to the end of my internship at the lab, I have always wanted to understand how you can visual data in 3D with QGIS. Kindly, through Prof. Isaksen’s guidance and the love of GIS from us interns, we were guided through the process of working with visualising data in 3D with QGIS. Below, you can see the flat plane image of the Europe.
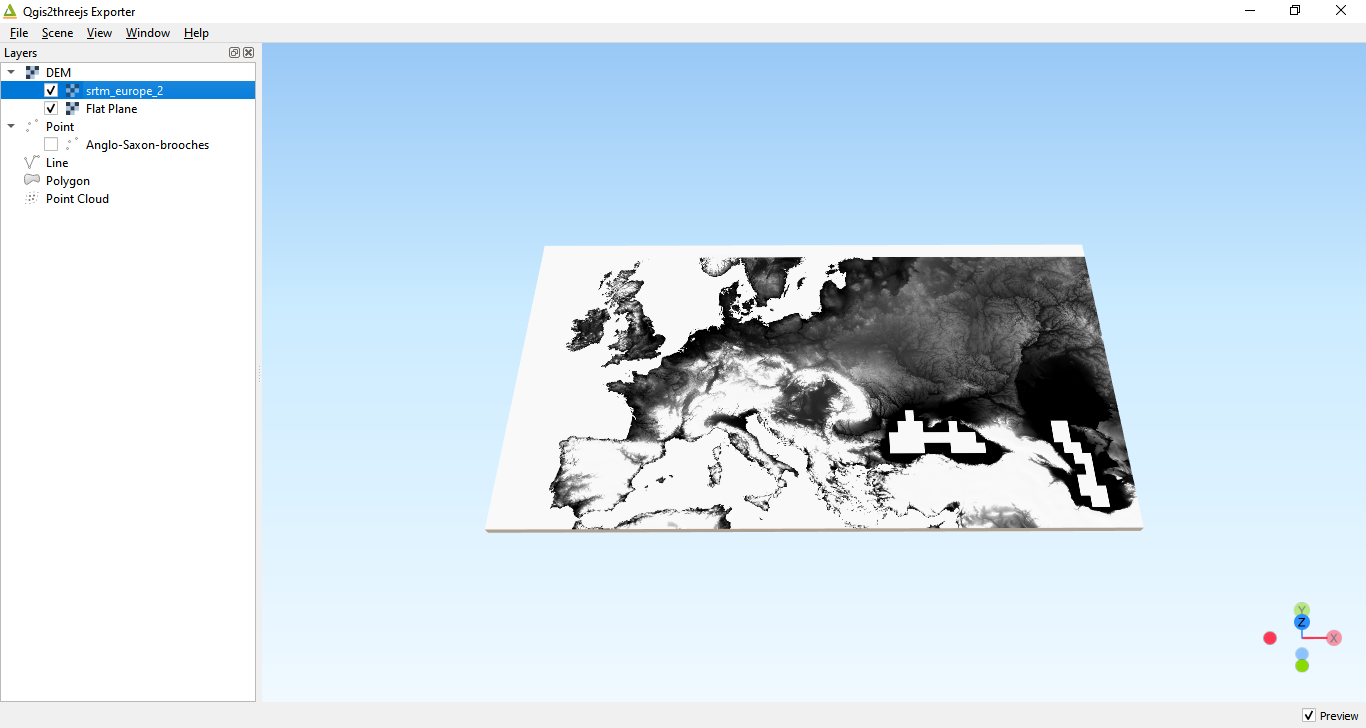
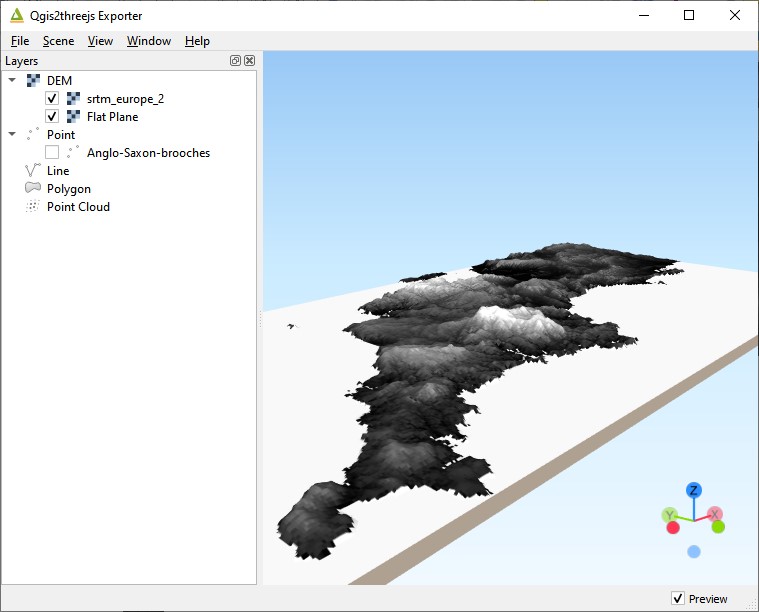
These files are uploaded as layers in QGIS as normal. As I am working through QGIS 3.6 still, I needed the plugin Qgis2threejs- if working in a later version, there will be options in the software without the need to download any plugins. After playing with the scene settings, you can see the second image of the flat plane now in 3D highlighting the vertical elements of the landscape (in this example it is highlighting Dartmoor).
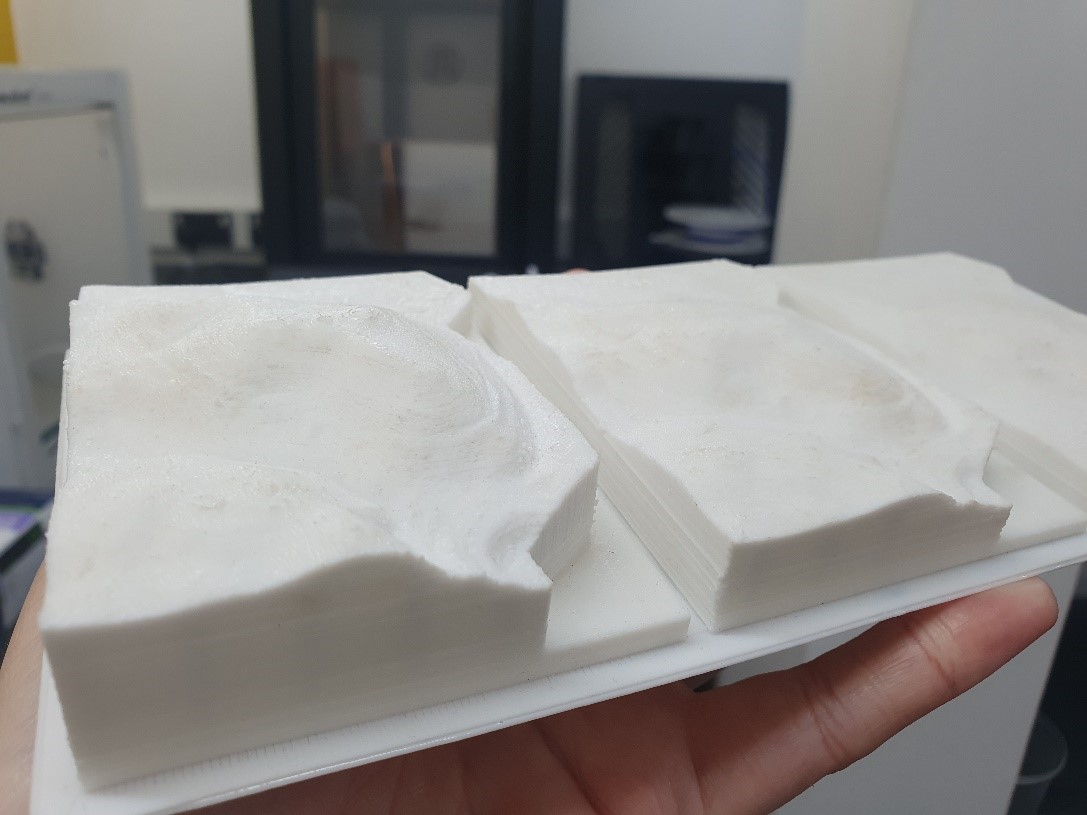
There are other maps I can add as a layer such as Google Terrain and my data itself to create a version of my GIS map in 3D. In addition, I can then export it to a browser so I can share with others or send to 3D print. This summer I am sure I will be playing with exploring the visualisation of data in 3D more and hope to eventually create a 3D print very similarly to the one created and shown by Professor Isaksen at his lecture those years ago. In addition, I am excited to practise these skills further to see if I can apply to them my own data in the future!